

AI agent observability is the practice of collecting enough telemetry to explain what an autonomous agent did, why it did it, how long each step took, which tools and models it used, what it cost, and where a failure or unsafe action originated. In a normal web request, an error may come from one service call. In an agent workflow, the same user request can trigger several model turns, tool calls, retries, handoffs and policy checks before a final response appears.
That makes observability a core production requirement rather than an optional dashboard. If you are already familiar with AI agents or multi-agent systems, observability is the layer that turns those hidden execution paths into inspectable engineering data.
What Is AI Agent Observability?
AI agent observability means making an agent workflow explainable from the outside through traces, metrics, logs and evaluations. The goal is not to expose private chain-of-thought. The useful operational record is the sequence of externally meaningful events: which agent ran, which model was called, which tool was selected, what arguments were sent, whether a guardrail fired, whether a handoff occurred, how long the step took and what result came back.
OpenTelemetry’s Generative AI semantic conventions are moving the ecosystem toward common telemetry names for model operations, token usage and related GenAI events. In May 2026, OpenTelemetry highlighted how these conventions can capture model calls, token counts and, when explicitly enabled, content such as prompts, completions, tool calls and tool results. That standardization matters because teams increasingly want observability that can move between frameworks and backends instead of being locked to one agent SDK.
Why AI Agents Are Harder to Monitor Than Normal Applications
Traditional application monitoring is often request-centric: a user request enters a service, triggers predictable downstream calls and returns a response. Agents add decision-making. Two identical requests may take different paths because the model chooses a different tool, calls the same tool twice, delegates to another agent or stops early.
- Non-deterministic paths: the same input may produce a different sequence of actions.
- Model and tool failures can look similar: a weak answer may come from the model, bad retrieval, a tool timeout, stale data or incorrect arguments.
- Multi-step cost: a single user action can create several LLM generations and tool calls.
- Handoffs create extra boundaries: in a multi-agent system, responsibility can move between agents.
- Security decisions matter: observability needs to show when a tool permission, approval gate or guardrail blocked an action. See Vynula’s guide to AI agent security for the complementary control layer.
The Four Signals You Need
1. Traces
A trace represents one end-to-end workflow. Spans represent the operations inside that workflow. For an agent, useful spans include an agent turn, model generation, tool invocation, handoff, guardrail check, retrieval step and custom business action. OpenAI’s Agents SDK follows this model: its built-in tracing records agent runs, model generations, function tool calls, handoffs, guardrails and custom events.
2. Metrics
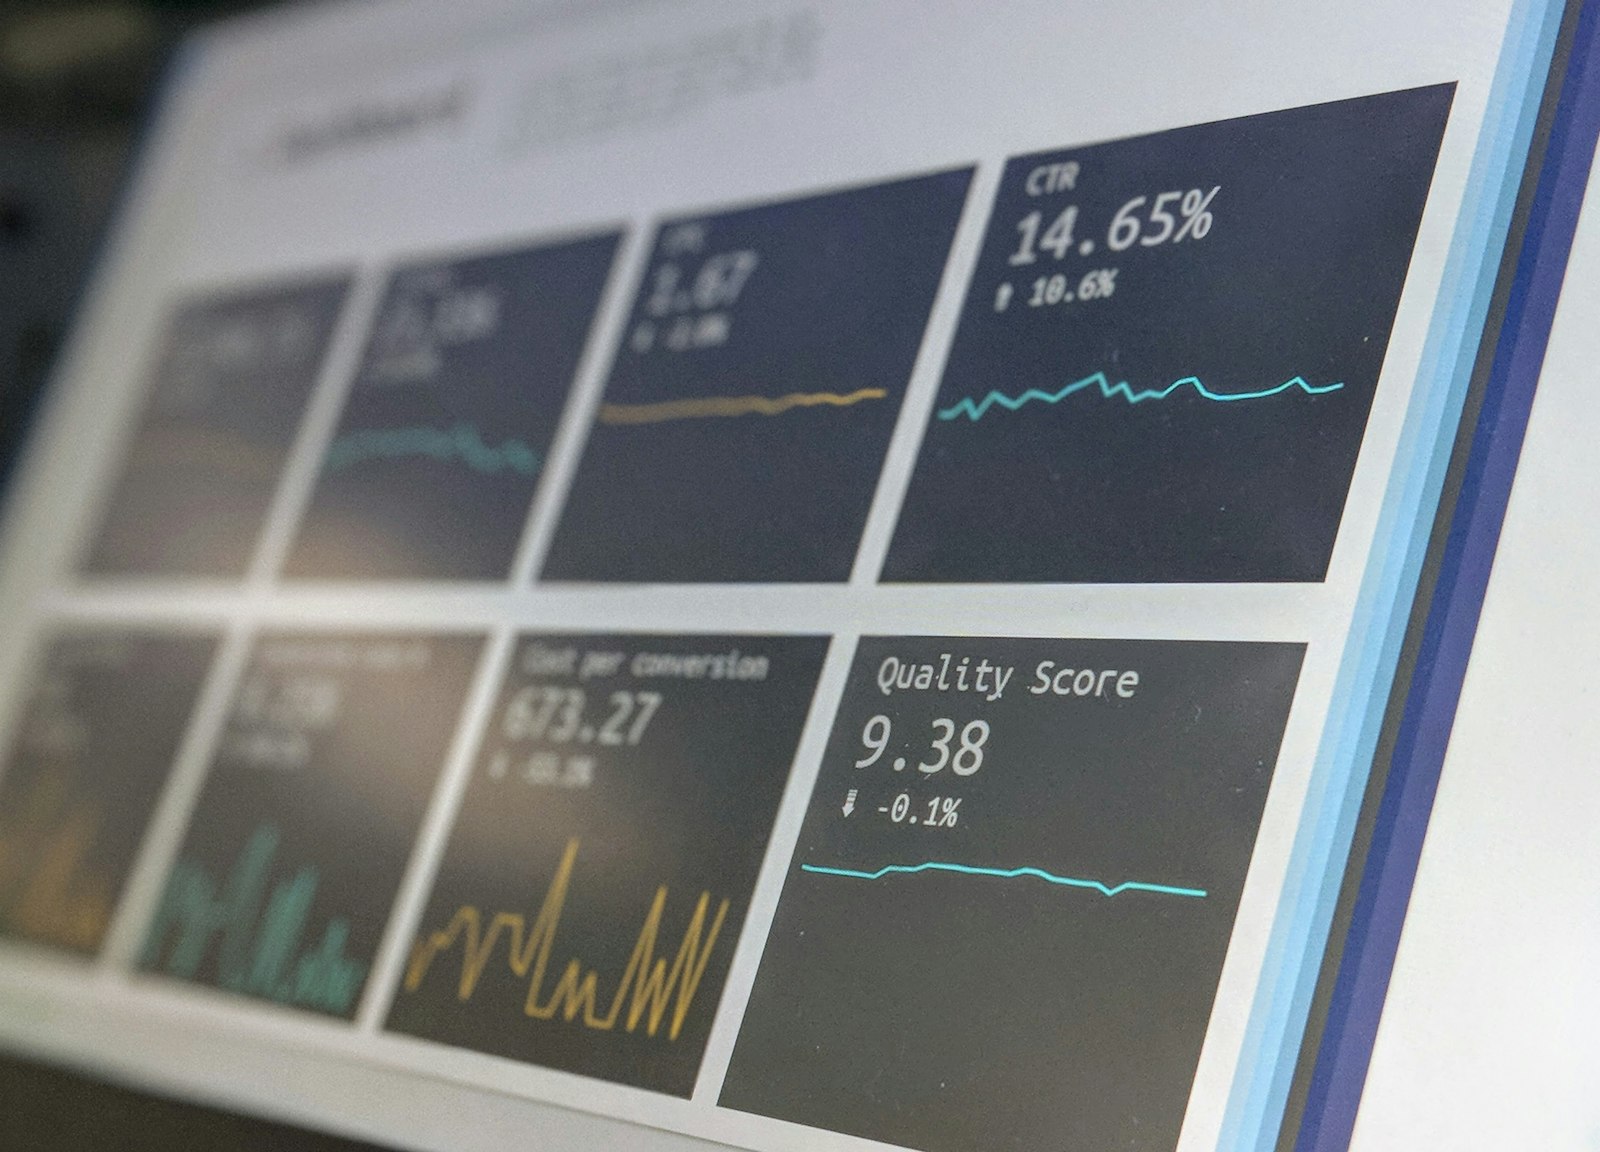
Metrics answer fleet-level questions: Is latency rising? Are tool errors increasing? Did a new model version double token usage? Are handoffs looping? Useful metrics include end-to-end latency, model latency, tool latency, error rate, retry count, tool success rate, token usage, estimated cost, guardrail activation rate and task-completion rate.
3. Logs and Events
Logs are still valuable for discrete operational events such as deployment versions, exceptions, policy decisions and infrastructure warnings. They are most useful when every record includes the same trace ID so an engineer can jump from a dashboard alert to the exact agent run.
4. Evaluations
Observability explains what happened; evaluations judge whether the outcome was good. A trace can show that a research agent successfully called three tools, while an evaluation can reveal that the final synthesis was still factually weak. Production teams need both.
What Should an Agent Trace Capture?
A practical trace should contain enough metadata to reproduce the operational path without collecting unnecessary sensitive information.
| Layer | Useful fields |
|---|---|
| Workflow | trace ID, workflow name, environment, deployment version |
| Agent | agent name/role, turn number, handoff target |
| Model | provider/model, latency, token counts, error status |
| Tool | tool name, sanitized arguments, result status, latency |
| Guardrail | policy name, allow/block outcome, approval requirement |
| Result | completion status, task outcome, evaluation score where available |
AI Agent Metrics That Actually Matter
Avoid building a dashboard with dozens of numbers that do not change engineering decisions. Start with metrics tied to reliability, quality and cost.
- P50/P95/P99 workflow latency to spot slow tails.
- Tool-call success rate broken down by tool.
- Retries per task to detect loops and unstable dependencies.
- Model calls per completed task to expose inefficient planning.
- Input/output tokens per task to measure cost drift.
- Handoffs per task in multi-agent workflows.
- Guardrail or approval rate for sensitive actions.
- Task success or evaluation score so operational efficiency is not optimized at the expense of quality.
How to Debug an Agent Failure
When a user reports that “the agent failed,” start with the trace rather than the final text. Find the first span where the run diverges from a known-good example. If the model chose the wrong tool, inspect the tool description and routing context. If the right tool was selected but failed, inspect arguments, authorization and latency. If the tool succeeded but the final answer was wrong, compare the model context and evaluation results.
This workflow becomes especially important when agents use memory. The state that influenced a decision may come from the current conversation, a retrieved document or a long-term memory layer. Vynula’s AI Agent Memory vs RAG vs Vector Databases comparison explains those layers in more detail.
Observability for Multi-Agent Systems
In multi-agent architectures, a trace should remain connected across handoffs. The parent workflow needs to show which specialist was selected, why the work moved, how long that specialist ran and what tools it used. Without propagation of a trace or correlation ID, teams end up with isolated logs that cannot reconstruct the full journey.
Agent discovery also belongs in the record. If an orchestrator dynamically selects a specialist from a registry, store the selected agent identity and the capability metadata used for routing. Vynula’s guide to how AI agents discover tools, skills and other agents covers that discovery layer.
Privacy and Security: Do Not Trace Everything by Default
Observability can become a data-leak risk if prompts, tool arguments, retrieved documents or model outputs contain credentials, personal information or confidential business data. OpenAI’s Agents SDK documentation explicitly warns that generation and function spans can contain sensitive inputs and outputs and provides controls for disabling sensitive-data capture.
A production policy should define what is recorded, redacted, hashed or excluded. Store the minimum data needed to diagnose failures. Protect trace backends like production databases: use access controls, retention limits, encryption and audit logs.
OpenTelemetry and Agent Observability in 2026
OpenTelemetry is increasingly important because agent stacks are heterogeneous. A workflow may include an application framework, an LLM provider, a vector database, an MCP server and ordinary HTTP services. Common semantic conventions make it easier to correlate those layers in one trace and export telemetry to different observability backends.
The OpenTelemetry project describes semantic conventions as common names and attributes that make telemetry easier to correlate and consume across libraries and platforms. GenAI-specific conventions extend that idea to model and agent operations. Teams should still check convention stability before hard-coding dashboards because parts of the GenAI/agent conventions continue to evolve.
A Practical 2026 Implementation Checklist
- Create one trace per user-visible agent workflow.
- Create spans for model calls, tools, handoffs, guardrails and important business operations.
- Propagate trace IDs across services and agent boundaries.
- Record model/deployment versions so regressions can be compared.
- Add latency, error, retry, token and cost metrics.
- Attach evaluation outcomes to traces where possible.
- Redact sensitive prompt/tool content by default.
- Build alerts around user impact, not only infrastructure health.
- Keep a small set of known-good traces for regression comparison.
- Review observability coverage whenever a new tool or agent is added.
FAQ
What is the difference between AI agent observability and LLM monitoring?
LLM monitoring focuses on model calls. Agent observability follows the entire workflow, including model calls, tools, retrieval, memory, handoffs, guardrails and business actions.
Is tracing the same as logging?
No. Logs are individual events. A distributed trace connects related spans into one end-to-end workflow so you can understand causal order and timing.
Should prompts and model outputs always be stored in traces?
No. They can contain sensitive information. Capture content only when policy allows it and when it is genuinely needed for debugging or evaluation.
Do I need OpenTelemetry?
Not necessarily, but standardized telemetry becomes increasingly useful as an agent system spans multiple frameworks, providers and services.
Related Vynula Guides
- AI Agents Explained
- Multi-Agent Systems Explained
- AI Agent Security in 2026
- How AI Agents Discover Tools, Skills and Other Agents
- What Is Agentic AI?